
NumPy arrays in 1D, 2D and 3D
Why NumPy exists, creating arrays directly and with methods, random arrays and data types, and how arrays differ from Python lists.
Free learning initiative
Every Python chart starts as an array or a DataFrame. Jobaaj Learnings is making this crash course free for every student — it covers that groundwork: NumPy arrays, broadcasting, Pandas Series and DataFrames, the data a chart is drawn from.
No payment step. Open the first lesson straight away.
Our learners now work at





What you'll learn
Before any chart there is data to hold, slice, filter and reshape. This course covers that part — NumPy for fast arrays and Pandas for labelled data — so a plot later is one line, not a mess of loops.
Why NumPy exists, creating arrays directly and with methods, random arrays and data types, and how arrays differ from Python lists.
Pick out values with indexes, slices and boolean masks — and learn why a slice is a view, and when you need a copy.
Basic operations, the dot product, comparisons and logical operators on whole arrays, then broadcasting and turning 1D data into 2D.
Change an array’s shape without touching its data, flatten it, shuffle it and sort it — then test yourself with the NumPy quiz.
Create Series four ways, read their attributes, use built-in functions, sort in place, customise the index, and use get(), value_counts(), apply() and map().
Create DataFrames, work with the index and columns, understand axis=0 and axis=1, do maths across columns and add new ones.
Why it's free
We built this to be learned from, not sold.
A lot of people who need a skill like this are exactly the people least able to pay for it — students between semesters, freshers before a first job, anyone rebuilding after a break. So we took the fee off.
Every lesson is open from the start. There's no locked second half and no upgrade waiting three modules in.
This isn't a promotional price or a trial. There's no clock on it and no fee arriving later.
Nothing was trimmed to make it free. It is the same material, at the same depth, as everything else we teach.
Come back to a lesson next month or next year. Access doesn't expire and nothing gets pulled behind a paywall.
Where it takes you
NumPy and Pandas are the first two imports in almost every analytics, data science and machine learning notebook.
The most common reason people take this — Pandas questions are a staple of data analyst technical rounds.
Clean, filter and summarise datasets in Python before they are charted or reported.
Prepare the features every model is trained on — all of it in NumPy and Pandas.
Answer questions from large files that are too big for a spreadsheet.
NumPy arrays are the format every machine-learning library expects.
Work with numeric data at scale with vectorised maths.
Salary bands are indicative market ranges for these roles in India, not an outcome promised by this course.
Sixty-second check
Five questions on the things that actually trip people up. Answer them and you'll get a read on where you stand — and which part of the course to start from.
Certificate
Submit your assignment and Jobaaj Learnings issues a verifiable certificate you can share anywhere.
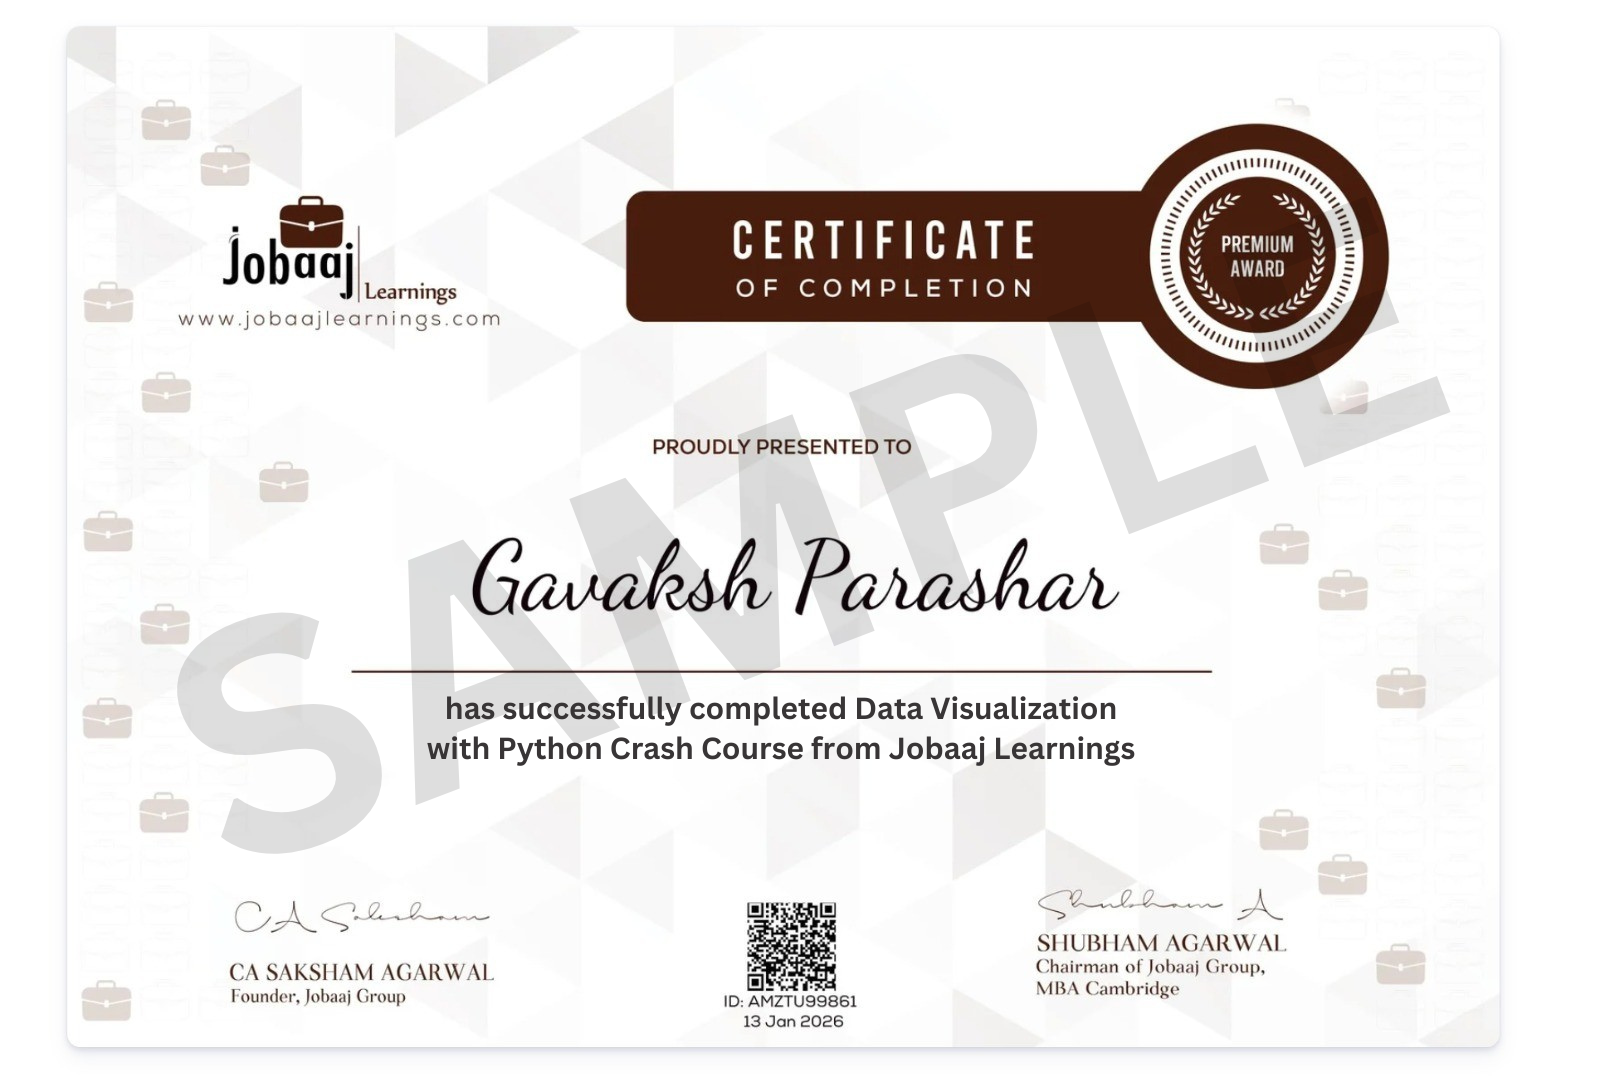
Issued and signed by Jobaaj Learnings, with a record an employer can check.
Add it to your résumé or post it to LinkedIn the day it's issued.
It says you finished the work and submitted the assignment — which is what it's worth showing for.
Learner journeys
Learners who moved into data analyst and developer roles after upskilling with Jobaaj Learnings.
Came from a science background with no data experience and moved into a data analyst role.
Moved from business analyst intern to data analyst at Codiant.
Went from fresher to data analyst at EY.
Went from fresher to data analyst at Invergence Analytics.
Restarted her career after a five-year break and moved into a data analyst role.
Moved from technical support engineer to SQL developer at Capgemini.
Keep going
NumPy and Pandas prepare the data. These courses cover the language underneath and the tools that show the result. All free from Jobaaj Learnings.
Variables, operators, conditions, loops and strings, from the first line.
ExploreQuery, join and aggregate the data behind every dashboard.
ExplorePower Query, data modelling and DAX, to a working report.
ExploreDimensions, measures, the Marks card and interactive filters.
ExploreFree dashboards on Google Sheets: tables, scorecards and controls.
ExploreThe interface, autofill, formats and styles that every data job starts in.
ExploreFAQ
Yes. Jobaaj Learnings provides it free of cost. There’s no fee to start, no trial period that ends, and no payment step anywhere in the flow.
None. The course starts from the very beginning and builds up from there, so you can begin with no prior experience in the subject.
Yes. Every lesson is recorded, so you can pause, rewind and come back whenever it fits around classes or work. There’s no schedule to keep up with.
No — and it’s worth knowing before you start. This course covers the groundwork every Python chart is built on: NumPy arrays and Pandas Series and DataFrames. Plotting libraries such as Matplotlib and Seaborn are not in these lessons.
You should be comfortable with variables, loops and lists. If you are not there yet, take the Python core concepts crash course first — it is also free and ends where this one begins.
There is a quiz after the NumPy, Series and Pandas sections, plus an assignment lesson in the NumPy section. Everything runs in a free notebook, so you can type along with each video.
Create and reshape NumPy arrays, select data with indexing, slicing and boolean masks, use vectorised maths and broadcasting instead of loops, and build, filter and transform Pandas Series and DataFrames — the prepared data any chart is drawn from.
Write to training@jobaaj.com and we’ll get back to you.
Free · Jobaaj Learnings
This crash course is completely free. Open the first lesson and create your first NumPy array.
Start learning free