
Install, connect, first chart
Download Tableau, connect a data source and build your first visual — then find your way around the data source page, the sheet and the shelves.
Free learning initiative
Tableau is how a lot of teams turn a spreadsheet into something a manager can read in ten seconds. Jobaaj Learnings is making this crash course free for every student — connecting data, building charts on the Marks card, and filtering, animating and annotating them.
No payment step. Open the first lesson straight away.
Our learners now work at





What you'll learn
Every chart in Tableau is a decision about where a field goes. This course teaches those decisions — which shelf, which mark, which filter — until you can take any table to a clear, interactive view.
Download Tableau, connect a data source and build your first visual — then find your way around the data source page, the sheet and the shelves.
The two kinds of field Tableau sorts everything into, and why discrete (blue) and continuous (green) change what the same field draws.
Colour, colour scales, size, labels, detail and tooltip — the controls that turn a plain bar chart into one that answers a question.
Plot two measures against each other, and use the date highlighter to pull one period out of a busy chart.
The filter interface, wildcard, condition and top-N filters, and context filters — including why the order filters run in changes the answer.
Step through time with the Pages shelf, animate the transitions, annotate what matters, and publish your workbook to the cloud to share it.
Why it's free
We built this to be learned from, not sold.
A lot of people who need a skill like this are exactly the people least able to pay for it — students between semesters, freshers before a first job, anyone rebuilding after a break. So we took the fee off.
Every lesson is open from the start. There's no locked second half and no upgrade waiting three modules in.
This isn't a promotional price or a trial. There's no clock on it and no fee arriving later.
Nothing was trimmed to make it free. It is the same material, at the same depth, as everything else we teach.
Come back to a lesson next month or next year. Access doesn't expire and nothing gets pulled behind a paywall.
Where it takes you
Tableau appears on job descriptions across analytics, consulting and operations — anywhere numbers have to be shown to people who will act on them.
The most common reason people take this — a published Tableau dashboard is a portfolio piece you can link in an application.
Turn raw tables into the charts and dashboards a team reviews every week.
Own the dashboards that leadership opens every morning.
Answer business questions visually, instead of in a long spreadsheet.
Replace static monthly reports with interactive views.
Build client-facing dashboards and walk stakeholders through them.
Salary bands are indicative market ranges for these roles in India, not an outcome promised by this course.
Sixty-second check
Five questions on the things that actually trip people up. Answer them and you'll get a read on where you stand — and which part of the course to start from.
Certificate
Submit your assignment and Jobaaj Learnings issues a verifiable certificate you can share anywhere.
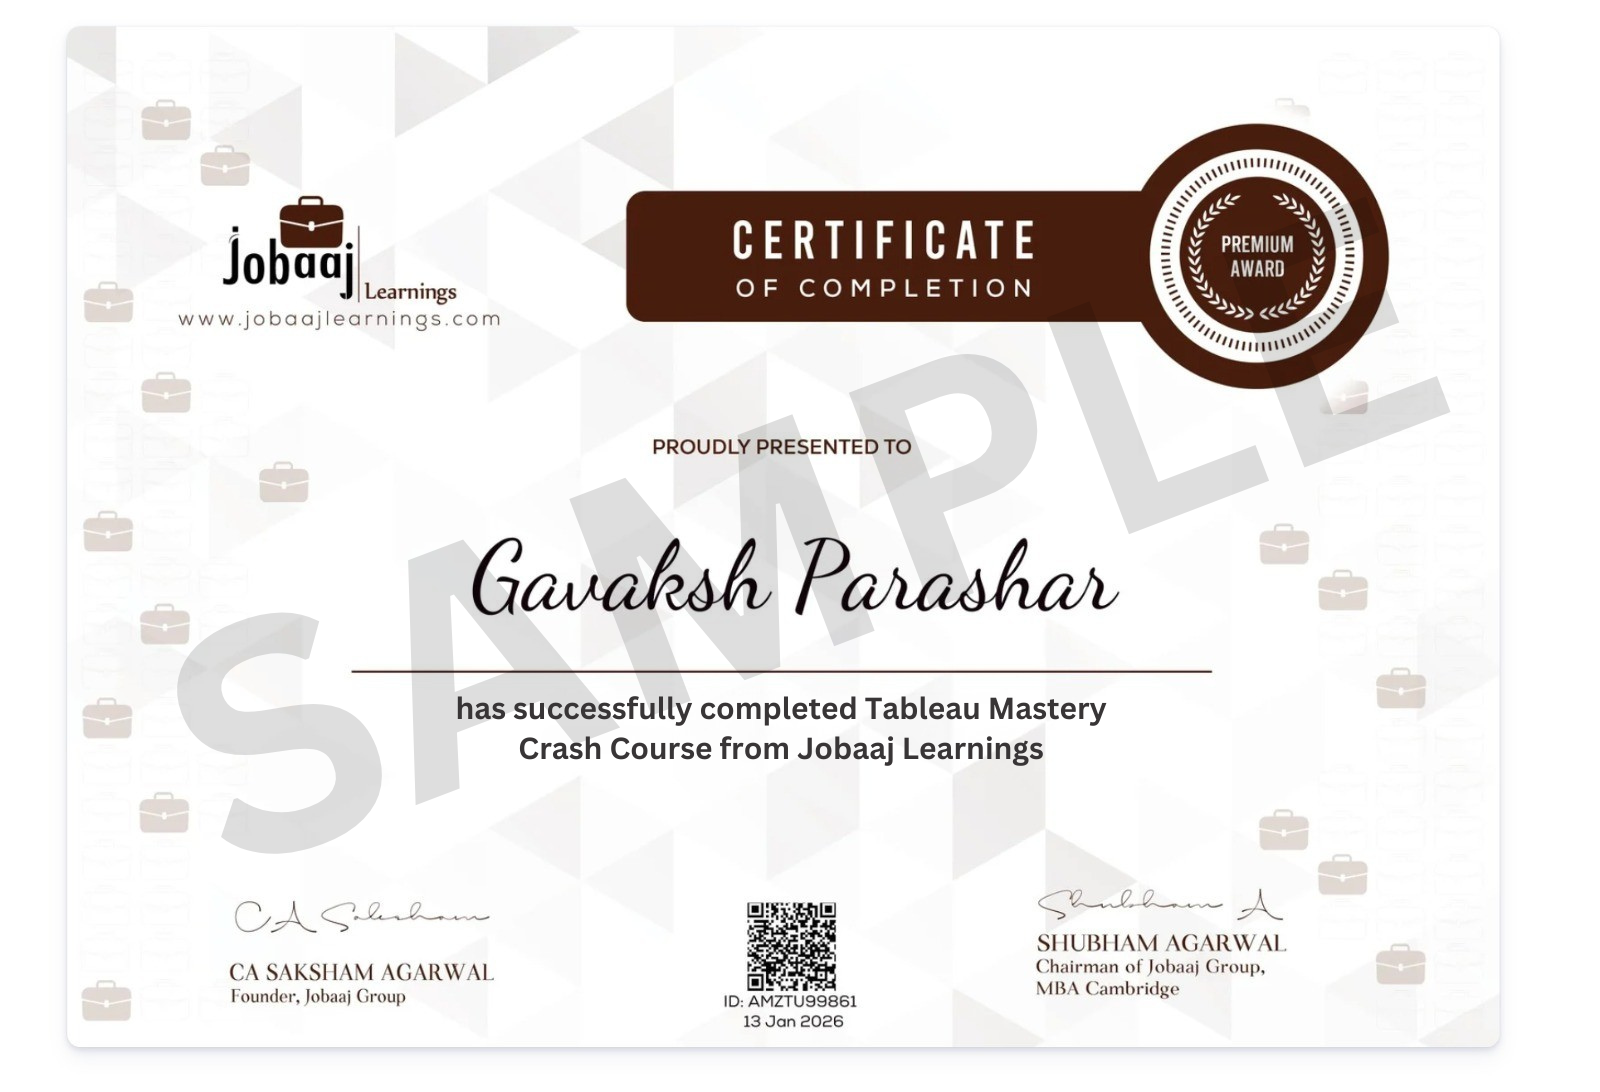
Issued and signed by Jobaaj Learnings, with a record an employer can check.
Add it to your résumé or post it to LinkedIn the day it's issued.
It says you finished the work and submitted the assignment — which is what it's worth showing for.
Learner journeys
Learners who moved into dashboard, BI and data analyst roles after upskilling with Jobaaj Learnings.
Went from fresher to risk analyst at Protiviti after building practical skills in Python, SQL and Tableau.
Went from B.Tech student to business intelligence developer, building reports that turn data into insights.
Moved up from data analyst executive to senior data analyst at Gallagher.
Moved from business data analyst to data analyst at LifeCell International.
Went from BBA graduate to data analyst at mFilterIt.
Secured a data analyst role at Toppan Merrill before finishing his graduation.
Keep going
Tableau shows the data. These courses are how you get it, shape it and show it in other tools. All free from Jobaaj Learnings.
Power Query, data modelling and DAX, to a working report.
ExploreFree dashboards on Google Sheets: tables, scorecards and controls.
ExploreThe interface, autofill, formats and styles that every data job starts in.
ExploreQuery, join and aggregate the data behind every dashboard.
ExploreVariables, operators, conditions, loops and strings, from the first line.
ExploreNumPy arrays, Pandas Series and DataFrames — the data every Python chart is drawn from.
ExploreFAQ
Yes. Jobaaj Learnings provides it free of cost. There’s no fee to start, no trial period that ends, and no payment step anywhere in the flow.
None. The course starts from the very beginning and builds up from there, so you can begin with no prior experience in the subject.
Yes. Every lesson is recorded, so you can pause, rewind and come back whenever it fits around classes or work. There’s no schedule to keep up with.
No. The first lesson shows you how to download and install Tableau, and you can follow the whole course with the free version. The resources lesson gives you the practice files used on screen.
No. It helps to have seen a table of rows and columns before, but the course starts from connecting a data source and explains dimensions and measures before any chart is built.
This course covers the core: the interface, dimensions and measures, the Marks card, filters, Pages, animation and annotation. Calculated fields and level-of-detail expressions are beyond its scope — the Power BI and SQL crash courses, both free, are good next steps for calculations.
Connect a data source, build and format bar, stacked and scatter charts, control colour, size, labels and tooltips on the Marks card, apply wildcard, top-N and context filters, animate a chart over time with Pages, and publish your workbook to share it.
Write to training@jobaaj.com and we’ll get back to you.
Free · Jobaaj Learnings
This crash course is completely free. Open the first lesson and drag your first field onto the canvas.
Start learning free