Ever wonder how businesses actually know they’re on the right track? It’s not guesswork or gut feeling—it’s all about measurement. That’s where KPIs, or Key Performance Indicators, come in. Think of them as your secret sauce, your compass, your North Star for making smart, informed decisions.
For business analysts, knowing how to read and use KPIs is like having a superpower. It helps you uncover meaningful insights, tell stories with data, and drive real impact across the organization. In this guide, we’ll dive into the ten essential KPIs every business analyst should have in their toolkit. Let’s get into it!
Exploring a career in Data Analytics? Apply Now!
Diving into the Essentials
First up are the foundational KPIs. These are the bread and butter metrics that provide a general health check of any business. Think of them as the vital signs.
Revenue Growth: This shows how much a company's income is increasing over time. It's a simple but powerful indicator of overall business health.
Profit Margin: How much money is left over after all the expenses are paid? A healthy profit margin is crucial for sustainability and growth.
Customer Acquisition Cost (CAC): Attracting new customers costs money. This KPI tracks how much is spent to acquire each new customer, essential for marketing effectiveness. Learn more about CAC.
Customer Lifetime Value (CLTV): This predicts the total revenue a business expects from a single customer over their entire relationship. Understanding CLTV helps justify marketing spend and focus on long-term customer relationships. Calculate CLTV.
Beyond the Basics: Metrics That Matter
Now, let’s move beyond the basics and explore some more specialized KPIs. These metrics offer deeper insights into specific areas of a business.

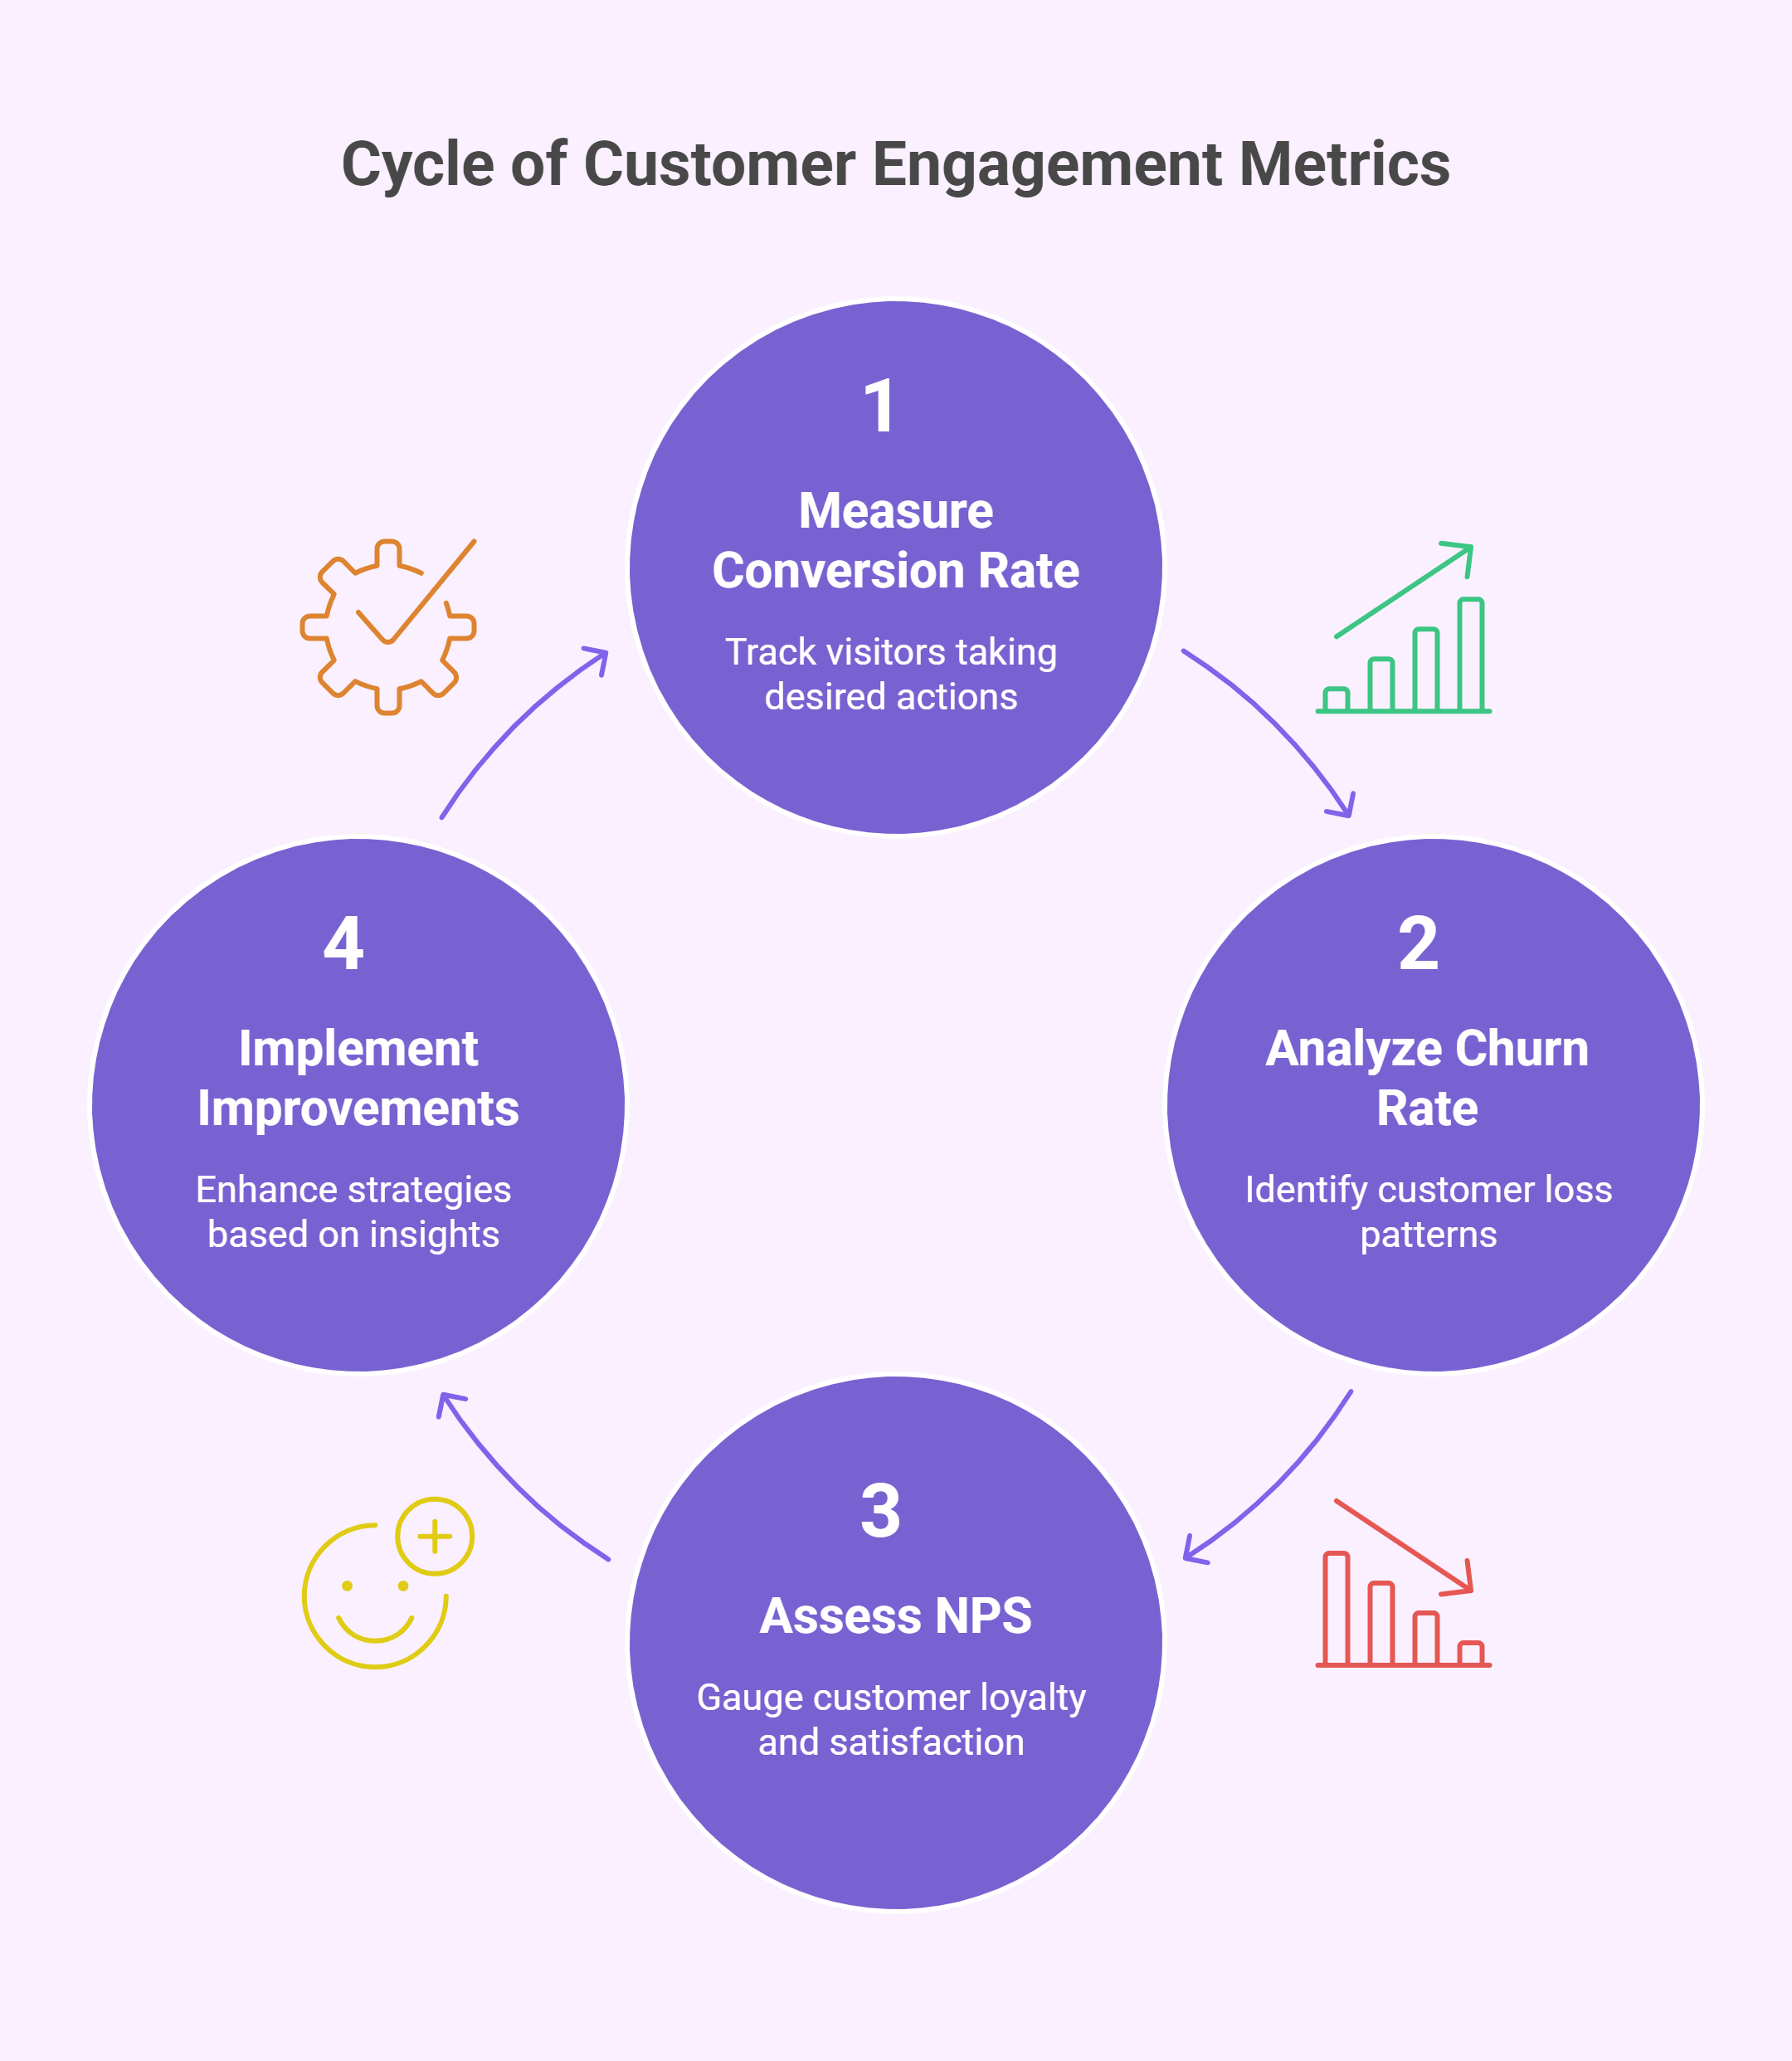
Conversion Rate: This measures how many visitors or leads take a desired action, like making a purchase or signing up for a newsletter. It's a key indicator of marketing and sales effectiveness. Understand Conversion Rates.
Churn Rate: Losing customers is inevitable, but a high churn rate can be a red flag. This KPI tracks the percentage of customers who cancel their subscription or stop using a product/service within a given timeframe. Learn about Churn Rate.
Net Promoter Score (NPS): This clever metric gauges customer loyalty and satisfaction by asking a simple question: "How likely are you to recommend us to a friend?" It's a valuable tool for understanding customer sentiment.
Operational Efficiency and Beyond
Finally, let's look at KPIs that shed light on a company's internal operations and overall market performance.
Return on Investment (ROI): This classic metric measures the profitability of an investment relative to its cost. It helps businesses prioritize projects and allocate resources effectively. Explore ROI.
Market Share: This represents the percentage of a market controlled by a specific company. It's a crucial indicator of competitiveness and market dominance.
Employee Satisfaction: Happy employees are productive employees. This KPI measures how satisfied employees are with their jobs and work environment, a vital factor for long-term success.
Bringing it All Together
These ten KPIs are just the starting point. The specific KPIs that matter most will vary depending on the industry, company size, and business goals.
But by understanding these fundamental metrics, business analysts can gain powerful insights into a company’s performance, identify areas for improvement, and drive strategic decision-making. It’s about connecting the dots, telling the story hidden within the data, and ultimately helping businesses thrive.
Dreaming of a Data Analytics Career? Start with Data Analytics Certificate with Jobaaj Learnings.


