Categories


Data Analysis, where understanding information leads to making smart choices. Imagine data as pieces of a puzzle, and SQL queries as the special tools that help us put the puzzle together. SQL stands for Structured Query Language, and it's like a language for talking to databases. It helps us find, organize, and transform data in a snap. In this blog, we're going to explore how to use SQL to dig into data.
Our goal?
To share the top 10 most useful SQL queries that will help you with important things in your data. Whether you're someone who knows a lot about data or you're just starting to learn, these SQL queries will help you in data analysis like a pro.
TOP 10 SQL Queries
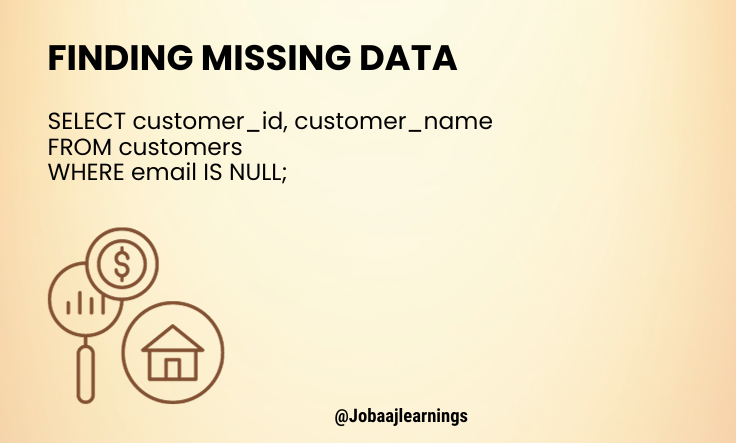
1. Finding Missing Data: To find missing data (NULL values) in a column, you can use the IS NULL condition. Let's find customers without a registered email:
This query selects customer_id and customer_name from the customers table for rows where the email column is NULL.
2. Pivoting Data: Pivoting converts rows to columns. Let's take pivot sales data to show total sales per year:

In this query, we pivot sales data to show the total sales of two specific products (product_1_sales and product_2_sales) for each sales year.
3. Grouping and Aggregation: This query groups data by a certain column and then performs an aggregation function on each group. To find the average salary per department:

The query calculates the average salary for each unique value in the department column of the employees table.
4. Joining Tables: JOIN operations combine data from multiple tables based on a common column. Let's join the customers and orders tables to get customer names and order dates:
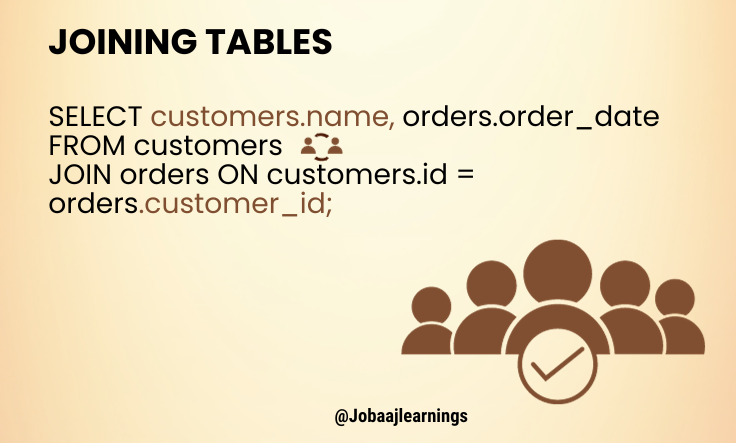
This query fetches the name column from the customers table and the order_date column from the orders table, joining them on the id and customer_id columns respectively.
5. Subqueries: Subqueries are queries embedded within other queries. For example, to find products with a price higher than the average product price:
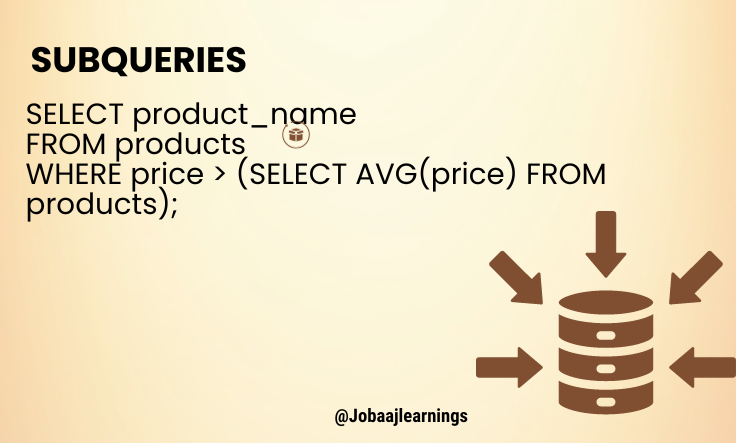
The subquery (SELECT AVG(price) FROM products) calculates the average product price, and the main query retrieves product_name from products where the price is higher than the calculated average.
6. Window Functions: Window functions perform calculations across a set of related rows. To rank employees within each department by salary:
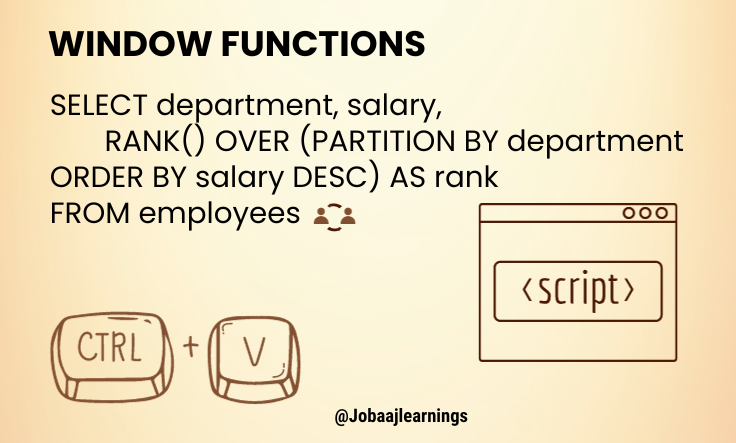
This query calculates the rank of employees within their respective departments based on their salary.
7. Conditional Logic: CASE statements allow conditional logic in queries. For instance, to categorize order quantities:
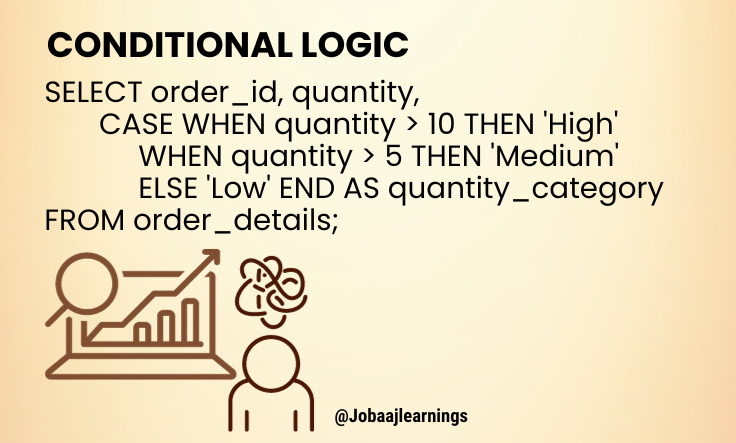
The CASE statement categorizes order quantities as 'High', 'Medium', or 'Low' based on different conditions.
8. Common Table Expressions (CTEs): CTEs create temporary result sets to simplify complex queries. To retrieve product names and their total sales for products with sales over $10,000:
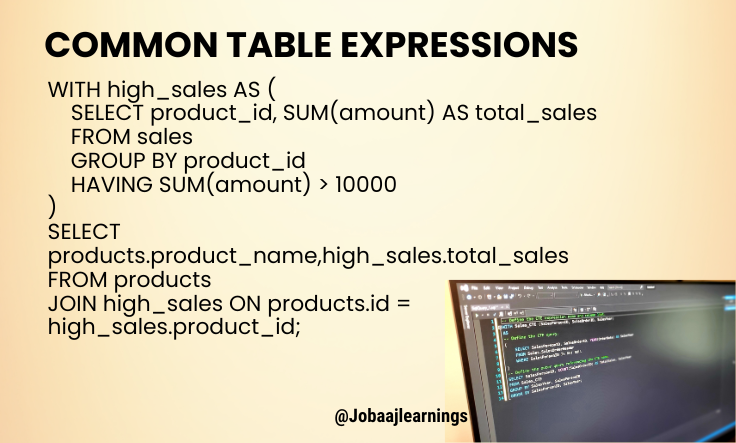
The CTE named high_sales calculates the total sales for each product, then the main query retrieves product names and total sales from both the products table and the CTE.
9. Date Aggregation by Month: To calculate monthly sales totals for a specific product:

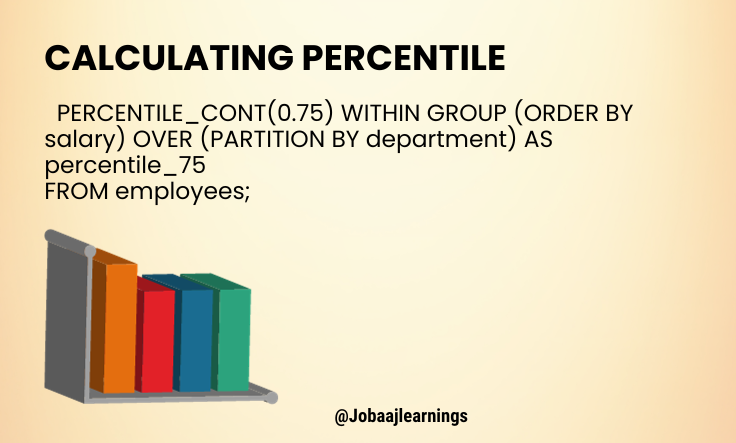
10. Calculating Percentiles: You can use window functions to calculate percentiles. Here, we find the 75th percentile salary within each department:
This query calculates the 75th percentile salary within each department using the PERCENTILE_CONT window function.
These explanations should provide you with a solid foundation for understanding and using these SQL queries for data analysis. Remember that practical use cases may vary, so adapt these queries to your specific requirements and database structure.