Categories


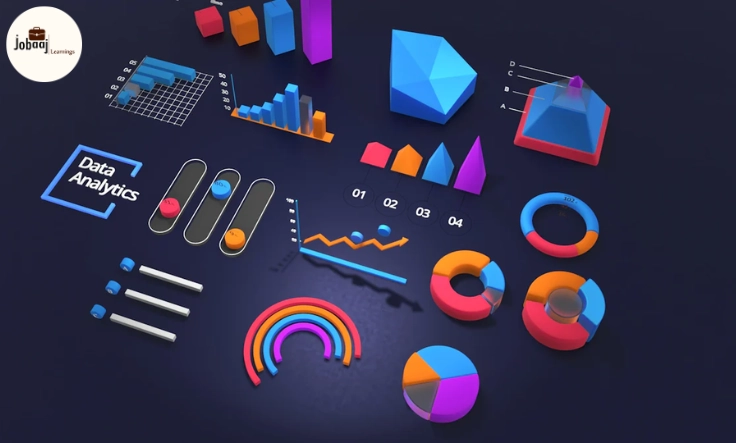
Think about the last time you looked at a giant spreadsheet full of numbers. Did it feel overwhelming? Now imagine if those same numbers were turned into a colorful chart or an interactive dashboard that told you the story behind them at a single glance. That’s the magic of data visualization—it transforms raw data into visuals that speak louder than words. For beginners, finding the right tool can feel like standing at the entrance of a big library, not knowing which book to pick. The good news is that there are beginner-friendly tools designed to make your journey simple, exciting, and surprisingly fun.
Exploring a career in Data Analytics? Apply Now!
In this blog, we’re diving deep into some of the best data visualization tools for beginners. We’ll talk about their unique features, how they can help you, and why each of them can make your data storytelling better than ever.
1. Microsoft Excel
Excel has been around for decades, and it’s still one of the strongest starting points for data visualization. Beginners love it because it’s simple and familiar. You can build bar charts, pie charts, scatter plots, and line graphs in minutes. Excel also has tools like pivot tables that help you organize and analyze data without needing advanced knowledge. What makes Excel powerful is its balance of simplicity and capability—you don’t need to be a data scientist to create charts that make sense.
2. Google Data Studio
Google Data Studio takes your boring spreadsheets and turns them into beautiful, interactive dashboards. It’s free, cloud-based, and integrates smoothly with Google Analytics, Google Ads, and Google Sheets. Beginners will enjoy its drag-and-drop interface and the variety of templates available. The ability to share dashboards online also makes it a great tool for collaboration. If you want to impress your team with live, automatically updating dashboards, this is the tool to try.
3. Tableau Public
Tableau Public is a crowd favorite because it’s powerful yet welcoming to beginners. The free version lets you create interactive dashboards and publish them online. The best part is its massive global community—you can learn by exploring dashboards built by others. Tableau helps you connect raw data with visuals in a way that feels like storytelling. As you grow, you’ll realize how deep this tool can go, making it a perfect choice if you want to gradually move from beginner to advanced user.
4. Power BI
Power BI by Microsoft is another top choice, especially if you’re looking to enter the professional world of data visualization. It’s beginner-friendly with its simple drag-and-drop interface, but it also has depth for when you want to get serious. It can connect to hundreds of data sources, build reports, and provide real-time analytics. Many companies use Power BI, so learning it not only helps with visualization but also boosts your professional skills.
5. Canva
If you’re someone who loves creativity and design, Canva is a fun option. It’s perfect for making simple charts, infographics, and presentations. Canva is not about heavy analytics but about making data look visually stunning. With thousands of templates and easy customization options, beginners can create polished visuals in minutes. It’s especially helpful if you want to share data on social media or make presentations that grab attention.
6. Infogram
Infogram is a great tool for turning data into engaging infographics, reports, and social media content. Beginners will love how easy it is to choose from templates and add interactive charts. Infogram focuses on storytelling visuals, making your data not just informative but also engaging. If you want to create data that people enjoy looking at, this tool is perfect.
7. Zoho Analytics
Zoho Analytics gives you the best of both worlds: simplicity and power. With its drag-and-drop builder, beginners can easily create charts and dashboards. At the same time, advanced features and AI-powered insights make it useful for when you want to dig deeper. It’s an excellent tool if you plan to grow into advanced analytics but want to start with something easy.
8. Chart.js
For beginners curious about coding, Chart.js is a lightweight and open-source JavaScript library that lets you create beautiful charts with just a few lines of code. It’s simple, well-documented, and easy to learn. Chart.js is a good choice if you want to get your hands a little dirty with coding while still keeping things approachable. Plus, it’s completely free.
Conclusion
The journey into data visualization doesn’t have to be complicated. Whether you start with Excel or Canva for simple visuals or dive into Tableau and Power BI for professional dashboards, each tool has something unique to offer. The key is to pick a tool that matches your goals, practice with real data, and slowly build confidence. Data visualization is about more than just charts—it’s about telling stories that make sense and spark action. Once you begin, you’ll realize how powerful it feels to turn numbers into visuals that people can instantly connect with.
Dreaming of a Data Analytics Career? Start with Data Analytics Certificate with Jobaaj Learnings.