Categories


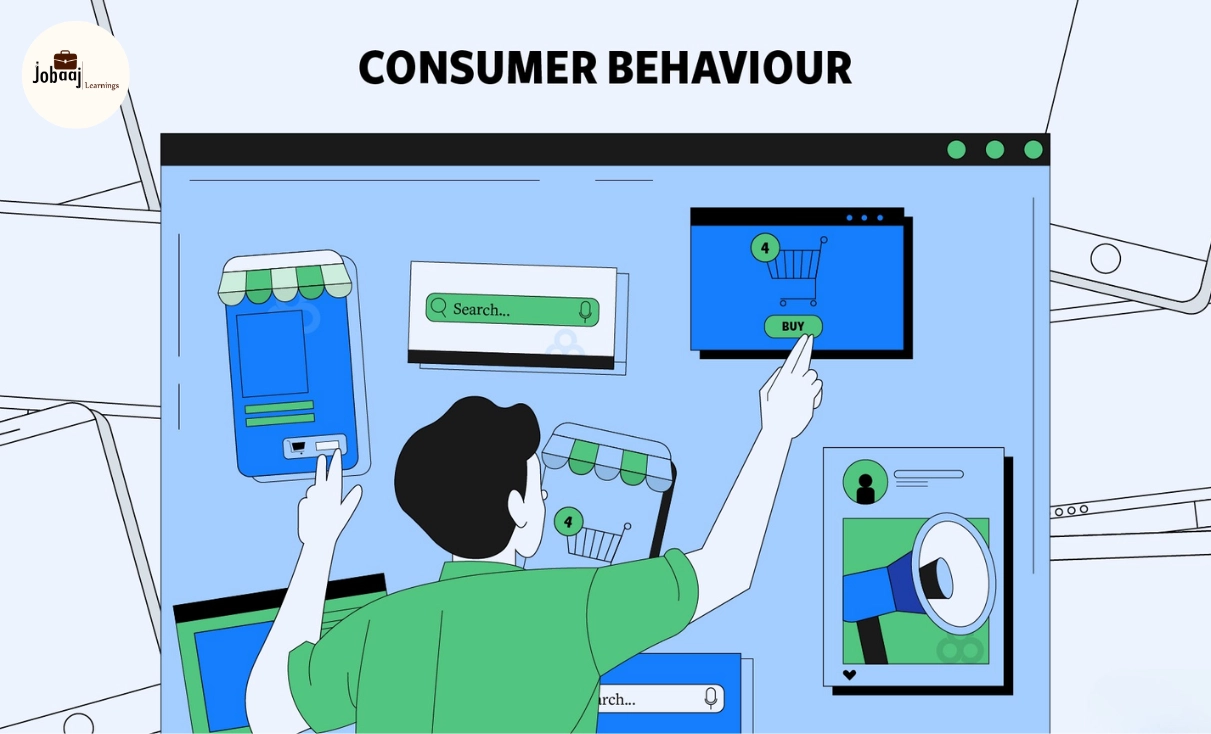
Every time someone clicks on a product, watches a reel, abandons a cart, opens an email, uses a coupon, or leaves a review, they are giving a clue.
That clue is data.
Customer behavior analysis is the skill of reading those clues and turning them into business decisions. It helps brands understand what people want, why they buy, why they leave, and what can bring them back.
For students, this is one of the most practical career areas inside data analytics, marketing analytics, product analytics, and business intelligence. It mixes creativity with numbers. You do not just look at spreadsheets. You understand real people through data.
If you enjoy psychology, marketing, business, technology, and problem-solving, learning how to analyze customer behavior with data can open strong career opportunities in 2026 and beyond.
What Is Customer Behavior Analysis?
Customer behavior analysis is the process of studying how customers interact with a business, product, website, app, store, ad campaign, or service.
It answers questions like:
1. Why are customers buying one product but ignoring another?
2. Why are users leaving the app after signing up?
3. Which customer group spends the most?
4. Which marketing channel brings loyal customers?
5. What makes people return after their first purchase?
6. Which customers may stop using the product soon?
In simple words, customer behavior analysis helps businesses understand customer actions, preferences, pain points, and buying patterns using data.
Why Customer Behavior Data Matters So Much Today
Earlier, businesses relied heavily on guesswork. A brand would launch an ad, wait for sales, and assume whether people liked it or not.
Today, companies can track customer behavior at every stage.
They can see what users search for, where they click, how much time they spend, which page they exit from, what they buy, and when they return.
This makes customer behavior data extremely powerful.
It helps businesses improve:
1. Product design
2. Marketing campaigns
3. Website experience
4. Customer retention
5. Sales strategy
6. Pricing decisions
7. Personalized recommendations
8. Customer support
9. Brand loyalty
For example, if an e-commerce company sees that many users add shoes to cart but do not complete payment, the problem may be hidden charges, slow checkout, lack of payment options, or poor trust signals.
A customer behavior analyst finds that problem using data.
How Customer Behavior Analysis Works
Customer behavior analysis usually follows a structured process. You collect data, clean it, study patterns, create insights, and suggest actions.
Let’s break it down.
Step 1: Define the Business Question
Before opening Excel, Power BI, SQL, or Python, you must know what problem you are solving.
A weak question is:
“Analyze customer data.”
A strong question is:
“Why did repeat purchases drop by 18% in the last quarter?”
Another strong question is:
“Which customer segment is most likely to buy our premium plan?”
Good analysis starts with a clear question.
Common customer behavior questions include:
1. Why are customers leaving?
2. Who are our best customers?
3. Which products are bought together?
4. Which campaign brings high-value users?
5. What causes cart abandonment?
6. Which customers are likely to purchase again?
7. What is the average customer lifetime value?
8. Which app feature improves retention?
The clearer the question, the better the analysis.
Step 2: Collect Customer Data
Customer behavior data comes from many sources. A good analyst knows where the data is coming from and what each source means.
Common Sources of Customer Behavior Data
1. Website Data
This includes page views, clicks, bounce rate, session duration, traffic source, landing pages, exit pages, and conversion rate.
Tools like Google Analytics 4 help track this data.
2. App Data
Apps track signups, logins, feature usage, screen visits, subscription actions, and drop-off points.
This is very useful for product analytics.
3. Transaction Data
This includes orders, revenue, purchase date, discount used, product category, payment method, and return history.
Retail, e-commerce, food delivery, fintech, and EdTech companies use this heavily.
4. CRM Data
CRM data includes customer name, contact details, lead status, follow-ups, sales notes, customer type, and communication history.
Sales and marketing teams depend on CRM insights.
5. Marketing Data
This includes ad clicks, impressions, email open rates, campaign performance, cost per lead, and return on ad spend.
It helps companies understand which channel gives the best results.
6. Customer Support Data
Support tickets, complaints, chat history, issue categories, and resolution time show where customers are struggling.
This data is useful for improving customer experience.
7. Survey and Feedback Data
Surveys, reviews, ratings, and Net Promoter Score help businesses understand customer sentiment.
This adds emotional context to numerical data.
Step 3: Clean and Prepare the Data
Raw customer data is rarely perfect.
It may have missing values, duplicate entries, wrong dates, inconsistent names, blank fields, or incorrect categories.
For example:
One customer may appear as “Rahul Sharma” in one place and “R. Sharma” in another.
A product category may be written as “Shoes”, “shoe”, and “Footwear”.
Dates may be in different formats.
Before analysis, this data must be cleaned.
Common Data Cleaning Tasks
- Remove duplicate customers
- Fix missing values
- Standardize date formats
- Correct spelling differences
- Group similar categories
- Remove invalid entries
- Check outliers
- Merge data from different sources
- Create calculated columns
Data cleaning may not look exciting, but it decides the quality of your final insights.
Bad data leads to bad decisions.
Step 4: Segment Customers
Customer segmentation means dividing customers into meaningful groups.
Not all customers behave the same way. Some buy often. Some buy only during discounts. Some browse but never purchase. Some spend more but need personal attention.
Segmentation helps businesses treat different customers differently.
Common Customer Segments
1. New Customers
These are people who recently made their first purchase or signed up.
The goal is to help them understand the product and make a second purchase.
2. Repeat Customers
These customers buy more than once.
They are valuable because retaining existing customers is often cheaper than acquiring new ones.
3. High-Value Customers
These customers spend more than average.
Brands often give them loyalty offers, premium support, and early access.
4. Discount-Driven Customers
These customers usually buy only when there is an offer.
Businesses use them carefully because excessive discounts can reduce profit.
5. At-Risk Customers
These customers have not purchased or logged in for a long time.
They may churn soon.
6. Loyal Customers
These customers regularly engage with the brand and may recommend it to others.
They are useful for referrals, testimonials, and community building.
Step 5: Study Customer Journey
The customer journey is the path a customer takes from discovering a brand to making a purchase and returning again.
A typical customer journey looks like this:
Awareness
Interest
Consideration
Purchase
Repeat purchase
Loyalty
In digital businesses, this may look like:
Ad click
Website visit
Product page view
Add to cart
Checkout
Payment
Delivery
Review
Repeat purchase
A customer behavior analyst studies where customers move forward and where they drop off.
For example, if 10,000 users visit a product page, 2,000 add to cart, but only 300 complete payment, the checkout stage needs attention.
This is called funnel analysis.
Step 6: Use Funnel Analysis
Funnel analysis shows how customers move through a step-by-step process.
It helps identify where users are dropping off.
Example of an E-Commerce Funnel
Website visitors: 50,000
Product page views: 20,000
Add to cart: 5,000
Checkout started: 2,000
Payment completed: 1,200
Here, the biggest drop is between product page views and add to cart.
That may mean:
Product pricing is too high
Product images are weak
Delivery information is unclear
Reviews are missing
Product description is not convincing
The page is loading slowly
Funnel analysis is used in e-commerce, EdTech, SaaS, fintech, food delivery, travel apps, and gaming platforms.
Step 7: Analyze Purchase Patterns
Purchase pattern analysis helps businesses understand what customers buy, when they buy, how often they buy, and how much they spend.
Important metrics include:
Average order value
Purchase frequency
Repeat purchase rate
Revenue per customer
Product category preference
Discount usage
Seasonal buying behavior
Payment method preference
For example, a fashion brand may discover that college students buy more during festive sales, while working professionals buy premium products at the start of the month.
These insights help plan campaigns, offers, inventory, and product recommendations.
Step 8: Calculate Customer Lifetime Value
Customer Lifetime Value, often called CLV or LTV, estimates how much revenue a customer may generate during their relationship with a business.
A simple version of CLV is:
Average order value × Purchase frequency × Customer lifespan
For example, if a customer spends ₹1,000 per order, buys 4 times a year, and stays for 3 years, the estimated customer lifetime value is ₹12,000.
CLV helps businesses decide how much they can spend to acquire a customer.
If a customer brings ₹12,000 in lifetime revenue, spending ₹500 or ₹1,000 to acquire that customer may be reasonable.
But spending ₹8,000 may not make sense unless profit margins are very high.
Step 9: Identify Churn Risk
Churn means a customer stops using a product or service.
Churn analysis helps businesses find warning signs before customers leave.
Signs of Churn Risk
- Customer has not logged in recently
- Purchase frequency has dropped
- Email engagement has reduced
- Support complaints have increased
- Subscription renewal is near
- Product usage has declined
- Customer stopped using key features
For example, if a student on an EdTech platform has not watched classes for 20 days, has not attempted quizzes, and has not opened reminder emails, they may be at risk of dropping out.
The company can send personalized support, learning reminders, or mentor follow-ups.
Step 10: Build Dashboards and Reports
After analysis, insights must be presented clearly.
A dashboard helps business teams see customer behavior quickly.
Common dashboard sections include:
Total customers
New customers
Repeat customers
Revenue
Average order value
Customer segments
Conversion rate
Churn rate
Top products
Campaign performance
Funnel drop-offs
Retention trends
Tools like Power BI, Tableau, Looker Studio, and Excel are commonly used for customer behavior dashboards.
A good dashboard does not just show numbers. It tells the business what needs attention.
Important Customer Behavior Metrics You Should Know
If you want to build a career in customer analytics, these metrics are essential.
1. Conversion Rate
Conversion rate shows the percentage of users who complete a desired action.
For example, buying a product, signing up, downloading an app, or booking a demo.
Formula:
Conversion Rate = Conversions ÷ Total Visitors × 100
2. Retention Rate
Retention rate shows how many customers continue using a product over time.
High retention usually means customers find value in the product.
3. Churn Rate
Churn rate shows the percentage of customers who stop using a product.
High churn is a serious warning sign for subscription businesses.
4. Average Order Value
Average Order Value, or AOV, shows how much customers spend per order.
AOV helps businesses improve pricing, bundles, and upselling.
5. Customer Acquisition Cost
Customer Acquisition Cost, or CAC, shows how much the company spends to acquire one customer.
It includes marketing and sales costs.
6. Customer Lifetime Value
CLV shows the total expected revenue from one customer over time.
It helps compare customer value with acquisition cost.
7. Repeat Purchase Rate
This shows how many customers buy more than once.
It is important for e-commerce, retail, food delivery, and D2C brands.
8. Net Promoter Score
NPS measures how likely customers are to recommend the brand.
It is useful for customer satisfaction and loyalty tracking.
Types of Customer Behavior Analysis
Customer behavior analysis is not one single method. It includes different types of analysis depending on the business problem.
1. Descriptive Analysis
This answers: What happened?
Example:
Sales dropped by 12% in May.
Repeat purchase rate increased after the loyalty campaign.
Most users dropped off at checkout.
2. Diagnostic Analysis
This answers: Why did it happen?
Example:
Sales dropped because website traffic from paid ads reduced.
Checkout drop-off increased after delivery charges were added.
Customers stopped using the app after a confusing update.
3. Predictive Analysis
This answers: What is likely to happen next?
Example:
Which customers may churn?
Which users may buy a premium plan?
Which leads are most likely to convert?
4. Prescriptive Analysis
This answers: What should we do next?
Example:
Offer a discount to at-risk customers.
Improve checkout design.
Send personalized recommendations.
Target high-value users with premium campaigns.
Customer Behavior Analysis Example for Students
Let’s say you are analyzing data for an online learning platform.
The company wants to know why students are not completing a course.
You collect data such as:
- Signup date
- Course selected
- Video watch time
- Quiz attempts
- Assignment submission
- Login frequency
- Payment status
- Mentor interaction
- Course completion status
After analysis, you find:
Students who complete the first quiz within 3 days are more likely to complete the course.
Students who do not log in during the first week have a high dropout risk.
Courses with longer videos have lower completion rates.
Students who interact with mentors are more likely to stay active.
Now your recommendations may be:
Send reminders in the first 3 days.
Break long videos into shorter lessons.
Add early quizzes to increase engagement.
Encourage mentor calls for inactive students.
Create a dashboard to track weekly student activity.
This is a strong example of how customer behavior analysis turns data into action.
Customer Behavior Analytics vs Marketing Analytics vs Product Analytics
These fields are connected, but they are not exactly the same.
1. Customer Behavior Analytics
Focuses on how customers act across the full journey.
It studies purchase habits, retention, churn, loyalty, preferences, and engagement.
2. Marketing Analytics
Focuses on campaign performance.
It studies ad clicks, leads, email performance, cost per acquisition, conversion rate, and return on ad spend.
3. Product Analytics
Focuses on how users interact with a product or app.
It studies feature usage, activation, retention, user journeys, and product drop-offs.
Quick Comparison
Customer behavior analytics looks at the customer.
Marketing analytics looks at campaigns.
Product analytics looks at product usage.
A strong analyst understands all three because modern businesses need connected insights.