Categories


Imagine you're running a business, and you receive a flood of data every day—sales numbers, customer feedback, website traffic, and more. At first, it feels manageable, but soon the data starts piling up, and it becomes overwhelming. You need a way to make sense of it all. You need something that gives you a quick overview of your most important metrics, in a way that's easy to read and act upon.
Exploring a career in Data Analytics? Apply Now!
This is where a data dashboard comes in. A good dashboard takes the massive amount of raw data and transforms it into meaningful, actionable insights. It's your one-stop destination for all the key metrics you need to monitor. In this blog, we’ll explore how to build a data dashboard that works for your business, so you can start making data-driven decisions with confidence.
Why Do You Need a Data Dashboard?
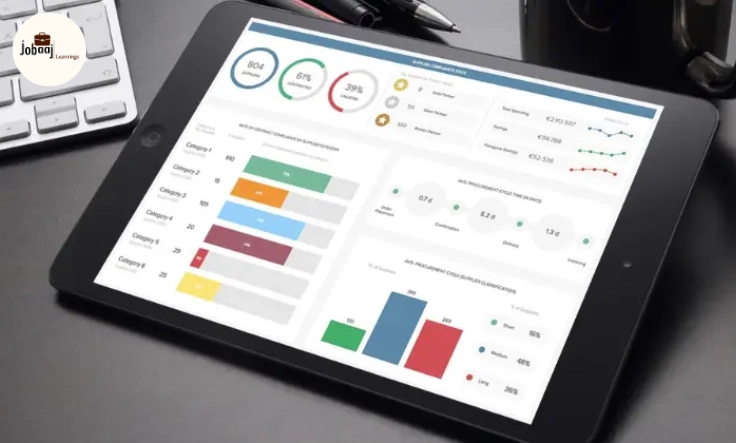
A data dashboard is like the dashboard of a car: it shows you everything you need to know in one glance. Whether you’re monitoring sales performance, website traffic, or customer satisfaction, a well-designed dashboard can save you time and effort. Instead of sifting through endless spreadsheets, you get a clear view of where your business stands.
Key Benefits of a Data Dashboard:
-
Efficiency: Spend less time searching for data and more time using it to make decisions.
-
Real-Time Insights: Dashboards provide real-time updates, helping you stay on top of any changes that need your attention.
-
Clarity: Instead of looking at raw data, you see visual representations that are easier to understand.
-
Data-Driven Decisions: With all your critical metrics in one place, you can make informed decisions faster.
How to Build Your Own Data Dashboard
Building a data dashboard for your business might seem like a daunting task, but it doesn't have to be. By following a few simple steps, you can create a dashboard that provides valuable insights into your business's performance.
Step 1: Identify Your Key Metrics
Before you start building your dashboard, it's important to identify which metrics matter most to your business. Here are some examples:
-
Sales Metrics: Total revenue, sales growth, number of sales
-
Customer Metrics: Customer satisfaction score, net promoter score (NPS)
-
Website Metrics: Website traffic, bounce rate, conversion rate
-
Marketing Metrics: Social media engagement, ad performance, email open rate
These metrics will form the backbone of your dashboard. Choose the ones that are most important to your business goals.
Step 2: Choose the Right Tools
There are plenty of tools available for building a business dashboard. Here are some popular options:
-
Google Data Studio: A free and user-friendly option for creating dashboards with Google Analytics and other data sources.
-
Tableau: A powerful dashboard tool with advanced analytics and data visualization features.
-
Power BI: Microsoft’s business analytics tool that integrates seamlessly with other Microsoft products.
-
Klips: A cloud-based dashboard tool with real-time reporting capabilities.
Each tool has its own set of features, so it’s important to choose one that fits your business needs and skill level.
Step 3: Design Your Dashboard
The design of your dashboard is crucial for usability. It should be visually appealing, yet simple enough that users can easily find and interpret the data. Here are a few design tips:
-
Keep It Simple: Only include the most important metrics. Too much information can overwhelm users.
-
Use Visuals: Bar charts, line graphs, and pie charts are great for visualizing data.
-
Make It Interactive: If your tool allows, make your dashboard interactive so users can click and drill down into the data.
-
Use Colors Wisely: Use color to highlight key metrics or trends. But avoid using too many colors—stick to a simple color palette.
Step 4: Connect Your Data
Once your dashboard is designed, the next step is to connect it to your data sources. If you're using a tool like Tableau or Power BI, you'll need to import your data from various platforms (e.g., your website analytics, sales software, social media, etc.). Make sure your data is clean and well-organized, as this will ensure your dashboard displays accurate information.
Step 5: Regularly Update Your Dashboard
Your dashboard should be a living document that gets updated regularly. Set a schedule for refreshing the data and ensure that the metrics reflect the most current information available. Most modern dashboard tools offer real-time updates, so you can always stay up to date with your business performance.
Conclusion: Empower Your Business with Data Insights
Building a data dashboard for your business can greatly enhance your decision-making process. By displaying key metrics in an easy-to-understand, visual format, you can gain insights into your business performance at a glance. With the right tools, design, and data, a dashboard becomes a powerful resource that helps you track progress and make informed decisions.
So, whether you’re tracking sales, customer satisfaction, or website performance, a dashboard will streamline your operations and keep you on track toward your business goals. The key is to start simple, then refine and expand as your business grows.
Dreaming of a Data Analytics Career? Start with Data Analytics Certificate with Jobaaj Learnings.