Categories


Retail moves fast. One slow-selling product, one delayed stock refill, one pricing mistake, or one weak store location can quietly eat into profit.
That is why modern retailers no longer rely only on monthly reports or gut feeling. They need live, visual, and easy-to-understand dashboards that show what is happening across sales, inventory, customers, margins, and store performance.
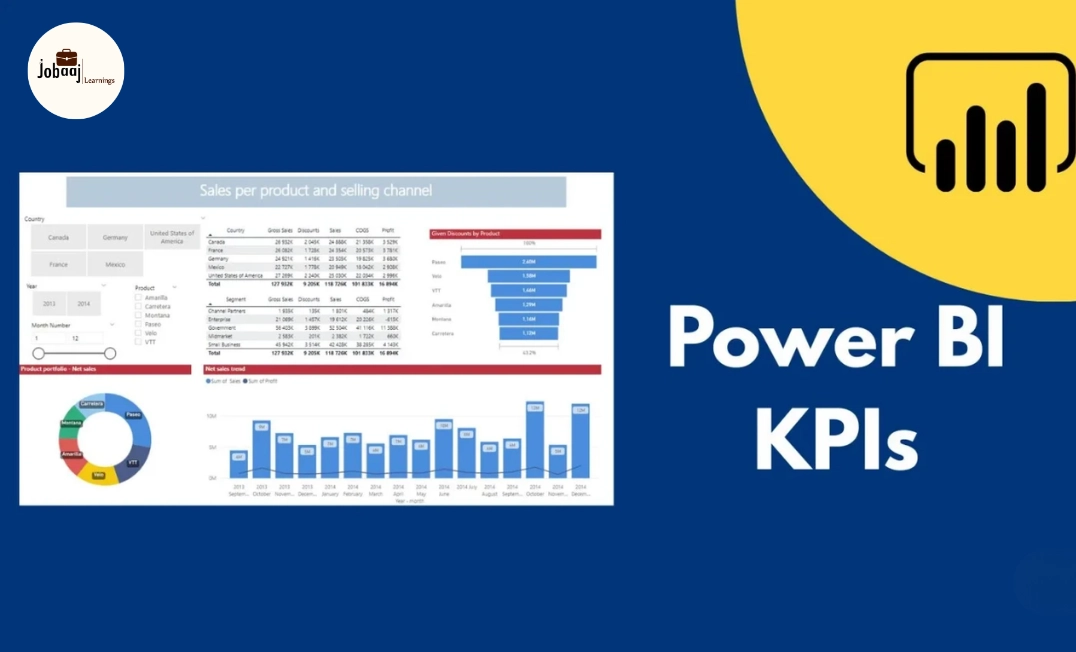
This is where a Power BI dashboard for retail KPI tracking becomes valuable.
Power BI helps retail teams convert raw data into clear business insights. Instead of checking multiple Excel files, POS exports, inventory sheets, and sales reports separately, managers can track everything in one interactive dashboard.
For students and beginners, this is also one of the best portfolio project ideas. It shows that you understand data visualization, business intelligence, retail analytics, KPI tracking, and real business decision-making.
What Is a Power BI Retail KPI Dashboard?
A Power BI retail KPI dashboard is a visual report that tracks important retail performance metrics in one place.
These metrics may include sales, revenue, profit margin, inventory turnover, average order value, footfall, customer retention, stock availability, and store-wise performance.
The purpose is simple: help decision-makers see what is working, what is not working, and where action is needed.
For example, a retail manager can use a dashboard to answer questions like:
- Which store is generating the highest sales?
- Which product category has the best profit margin?
- Which items are overstocked or understocked?
- Which region is showing weak performance?
- Are discounts increasing revenue or reducing profit?
- Which customers are buying again?
A good dashboard does not just show numbers. It tells a business story.
Why KPI Tracking Matters in Retail
Retail is a high-volume business. Every day, stores generate data from billing systems, online orders, returns, customer loyalty programs, stock movements, marketing campaigns, and supplier updates.
Without KPI tracking, this data stays scattered.
A Power BI dashboard brings these data points together and helps teams make faster decisions.
1. Better Sales Visibility
Retail teams can track daily, weekly, monthly, and yearly sales performance.
They can compare actual sales with targets and quickly identify sales dips.
This helps store managers act early instead of waiting until month-end.
2. Smarter Inventory Management
Inventory is one of the biggest cost areas in retail.
Too much stock blocks cash. Too little stock leads to lost sales.
A Power BI dashboard can show fast-moving, slow-moving, dead-stock, and out-of-stock products.
3. Improved Profitability
Revenue alone does not show business health.
A store may generate high sales but still have weak profit due to heavy discounts, high returns, or poor product margins.
Retail KPI dashboards help track gross margin, net margin, discount impact, and category-wise profitability.
4. Stronger Customer Insights
Retailers need to understand who is buying, what they are buying, and how often they return.
Power BI can help analyze customer segments, repeat purchase rate, average basket size, and customer lifetime value.
5. Faster Business Decisions
A well-designed dashboard reduces dependency on manual reporting.
Leadership teams can check performance instantly and focus on decisions rather than data collection.
Key Retail KPIs to Track in a Power BI Dashboard
A strong Power BI dashboard should not include every possible metric. Too many numbers create confusion.
The best dashboards focus on KPIs that directly support business decisions.
Sales KPIs
Sales KPIs show whether the business is growing and where revenue is coming from.
1. Total Sales
This is the total revenue generated from all transactions.
It is usually shown as a card visual at the top of the dashboard.
2. Sales Growth
Sales growth compares current sales with a previous period.
For example, this month vs last month or this year vs last year.
3. Sales by Store
This shows which store locations are performing well and which need attention.
A map visual or bar chart works well for this KPI.
4. Sales by Product Category
This helps managers identify the strongest and weakest categories.
For example, electronics may have high revenue, while accessories may have better margins.
5. Average Order Value
Average Order Value, or AOV, shows how much customers spend per order.
Formula:
AOV = Total Revenue / Number of Orders
A higher AOV usually means better cross-selling, upselling, or premium product sales.
Profitability KPIs
Sales are important, but profit is the real test.
1. Gross Profit
Gross profit shows revenue after deducting cost of goods sold.
Formula:
Gross Profit = Revenue - Cost of Goods Sold
2. Gross Margin Percentage
This shows how much profit is generated from each rupee of sales.
Formula:
Gross Margin % = Gross Profit / Revenue × 100
3. Net Profit
Net profit gives a more complete view after operating expenses.
This is useful for senior management and finance teams.
4. Discount Impact
Discounts can increase sales, but they can also reduce margins.
A Power BI dashboard can compare discounted sales with non-discounted sales to see whether promotions are truly profitable.
Inventory KPIs
Inventory tracking is essential for retail operations.
1. Inventory Turnover
Inventory turnover shows how quickly stock is sold and replaced.
Formula:
Inventory Turnover = Cost of Goods Sold / Average Inventory
A high turnover usually means strong demand. A very low turnover may mean slow-moving stock.
2. Stock-Out Rate
This shows how often products are unavailable when customers want to buy them.
A high stock-out rate can damage customer trust and reduce sales.
3. Dead Stock
Dead stock refers to products that have not sold for a long time.
A dashboard can highlight dead stock by product, category, store, or supplier.
4. Reorder Level
This helps retail teams know when to restock.
Power BI can flag products that are below minimum stock levels.
Customer KPIs
Customer KPIs help retailers understand buying behavior.
1. Customer Retention Rate
This shows how many customers come back to buy again.
Retailers with strong retention spend less on acquiring new customers.
2. Repeat Purchase Rate
This measures the percentage of customers who make more than one purchase.
It is especially useful for grocery, fashion, beauty, electronics, and e-commerce brands.
3. Customer Lifetime Value
Customer Lifetime Value, or CLV, estimates how much revenue a customer may generate over time.
This helps businesses decide how much they can spend on marketing and loyalty programs.
4. Customer Segmentation
Power BI can segment customers by location, purchase frequency, spending level, product preference, and loyalty status.
Operational KPIs
Operational KPIs show how efficiently the retail business is running.
1. Store Footfall
Footfall tracks how many people visit a physical store.
When connected with sales, it helps calculate conversion rate.
2. Conversion Rate
Conversion rate shows how many visitors actually buy.
Formula:
Conversion Rate = Number of Purchases / Number of Visitors × 100
3. Return Rate
Return rate shows the percentage of sold products that customers return.
A high return rate may indicate quality issues, wrong sizing, poor descriptions, or weak customer expectations.
4. Employee Sales Performance
Retailers can track sales by salesperson, team, shift, or store.
This helps with performance reviews and training.
What Should a Retail Power BI Dashboard Include?
A well-built dashboard should be simple, visual, and action-focused.
Here is a practical dashboard structure.
Page 1: Executive Summary
This page gives a quick business overview.
Include:
- Total Sales
- Total Profit
- Gross Margin %
- Total Orders
- Average Order Value
- Sales Growth %
- Top Performing Store
- Top Product Category
Use cards, line charts, and simple bar charts.
This page is mainly for owners, senior managers, and business heads.
Page 2: Sales Performance
This page explains where sales are coming from.
Include:
- Sales by month
- Sales by store
- Sales by region
- Sales by category
- Sales by product
- Target vs actual sales
Use line charts, clustered bar charts, matrix tables, and map visuals.
Page 3: Product and Category Analysis
This page shows product-level performance.
Include:
- Top-selling products
- Low-selling products
- High-margin products
- Low-margin products
- Discounted product performance
- Product return rate
This page is useful for category managers and merchandising teams.
Page 4: Inventory Dashboard
This page focuses on stock movement.
Include:
- Current stock
- Stock-out products
- Slow-moving products
- Dead stock
- Inventory turnover
- Reorder alerts
- Supplier-wise stock status
Use conditional formatting to highlight risk areas.
Page 5: Customer Insights
This page explains customer behavior.
Include:
- New vs returning customers
- Customer retention rate
- Repeat purchase rate
- Average spend per customer
- Customer segment analysis
- Loyalty program performance
This page is useful for marketing, CRM, and customer success teams.
Page 6: Store Performance
This page compares store-level performance.
Include:
- Store-wise sales
- Store-wise profit
- Store footfall
- Store conversion rate
- Employee productivity
- Returns by store
- Regional comparison
This helps leadership identify which stores need support, training, or operational changes.
Power BI Dashboard vs Excel Dashboard for Retail
Both Excel and Power BI are useful, but they serve different levels of reporting.
Excel Dashboard
Excel is good for small datasets, simple reports, quick calculations, and basic charts.
It is familiar and easy to start with.
But Excel becomes difficult when data grows, reports need frequent updates, or multiple people need the same live version.
Power BI Dashboard
Power BI is better for larger datasets, automated reports, interactive dashboards, multiple data sources, and business-wide reporting.
It also supports advanced data modeling and easier sharing.
For beginners, Excel is a good starting point. But for retail analytics careers, Power BI adds more professional value.
Power BI vs Tableau for Retail KPI Dashboards
Tableau and Power BI are both powerful data visualization tools.
Power BI is often preferred by companies already using Microsoft tools like Excel, Azure, Teams, SharePoint, and Microsoft Fabric.
Tableau is known for strong visual design and flexible analytics.
Practical Retail Dashboard Project Ideas for Students
A Power BI dashboard for retail KPI tracking is a strong portfolio project because it is practical and easy to explain in interviews.
Here are some project ideas.
1. Supermarket Sales Dashboard
Track sales, profit, customer type, product line, payment method, and city-wise performance.
Best for beginners.
2. Fashion Retail Dashboard
Track category sales, size-wise returns, seasonal trends, store performance, and discount impact.
Best for students interested in fashion analytics.
3. E-Commerce Retail Dashboard
Track orders, revenue, conversion rate, returns, customer segments, and marketing channel performance.
Best for digital commerce and marketing analytics roles.
4. Inventory Management Dashboard
Track current stock, reorder level, dead stock, stock-out rate, and supplier performance.
Best for operations and supply chain analytics roles.
5. Retail Store Manager Dashboard
Track store sales, employee performance, footfall, conversion rate, and daily target achievement.
Best for business intelligence and retail operations roles.
Approximate Salary Range in India
|
|
|
|
|
|
|
|
|
|
|
|
|
|
|
|
|
|
|
|
|
|
|
|
These are broad ranges. Product companies, global capability centers, consulting firms, and high-growth retail brands may pay more for strong analytics talent.