Categories
















Data drives every decision in the modern business world, and SaaS companies generate vast amounts of it daily. While having data is important, the real power lies in how you visualize and interpret it. Effective data visualization not only conveys insights clearly but also guides strategic decision-making, identifies trends, and highlights actionable patterns.
Exploring a career in Data and Business Analytics? Apply Now!
In this guide, we cover five essential tips for SaaS data visualization, how to apply them, the tools you can use, and best practices to ensure your dashboards and reports are both insightful and impactful.
1. Know Your Audience and Objective
The first step in data visualization is understanding who will use the data and why.
- Internal Teams: Executives might need high-level KPIs, while product managers require feature usage metrics.
- External Stakeholders: Investors may want growth trends and revenue insights.
Design visualizations that align with the audience’s decision-making needs. For example, use line charts for trends, bar charts for comparisons, and heatmaps for engagement patterns.
A clear objective ensures that your visualizations communicate insights effectively without overwhelming the viewer.
2. Prioritize Clarity Over Complexity
In SaaS analytics, dashboards often become cluttered with too many metrics or charts.
- Use minimalist design principles.
- Highlight key metrics and trends.
- Avoid unnecessary colors, 3D charts, or excessive gridlines.
Choose visualizations that are intuitive for example, funnel charts for conversion tracking or stacked bar charts for feature adoption comparison.
Impact: Clear and concise visuals reduce cognitive load, making insights easier to grasp and act upon.
3. Choose the Right Visualization for the Data
Not every type of chart works for all data. Selecting the correct type ensures that insights are accurate and actionable.
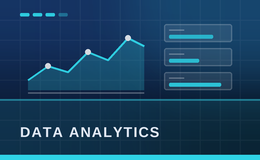
- Time Series Data: Use line charts to show trends over time.
- Comparative Data: Use bar charts to compare features, pricing tiers, or segments.
- Proportional Data: Pie charts or stacked bar charts can highlight percentages or distributions.
- Correlation Data: Scatter plots are useful to analyze relationships between two variables.
Avoid distorting data axes should be scaled correctly, and charts should represent metrics truthfully.
Correct visualization prevents misinterpretation and supports reliable decision-making.
4. Incorporate Interactive Dashboards
SaaS dashboards are more effective when interactive elements allow users to explore the data.
- Enable filters by date, region, or customer segment.
- Allow drill-downs for deeper insights into metrics.
- Use hover-over tooltips to provide additional context without cluttering the chart.
Tools: Tableau, Power BI, Looker, Chartio, or SaaS-native dashboards like HubSpot Analytics or Salesforce Reports.
Interactive dashboards empower teams to explore data themselves, uncover hidden patterns, and answer business questions quickly.
5. Focus on Storytelling with Data
Visualization is not just about charts it’s about communicating a narrative.
- Arrange charts logically to highlight trends, successes, or areas needing attention.
- Use annotations or callouts to explain spikes, dips, or anomalies.
- Combine multiple visuals to tell a cohesive story from raw metrics to business insights.
Include contextual insights and actionable recommendations alongside visuals.
Impact: Storytelling transforms dashboards from static reports into strategic decision-making tools.
Bonus Tips
- Consistency: Use consistent colors, fonts, and labeling across all dashboards.
- Mobile-Friendly: Many SaaS dashboards are accessed on mobile—ensure readability on small screens.
- Regular Review: Update visualizations to reflect new KPIs, features, or customer feedback.
Conclusion
Effective SaaS data visualization is a blend of clarity, accuracy, interactivity, and storytelling. By following these five tips, your dashboards and reports will communicate insights more effectively, support strategic decisions, and empower teams to act on data confidently.
In SaaS, where data is abundant, well-crafted visualizations transform raw metrics into business intelligence, ensuring growth, retention, and improved customer experience.
Aspiring for a career in Data and Business Analytics? Begin your journey with a Data and Business Analytics Certificate from Jobaaj Learnings.
Frequently asked questions
What is SaaS data visualization?
SaaS data visualization is the process of creating charts, dashboards, and reports to represent data generated by SaaS products, making insights understandable and actionable.
Why is data visualization important for SaaS companies?
It helps teams track performance, understand user behavior, identify trends, and make data-driven decisions that improve product success and customer experience.
Which charts are best for SaaS analytics?
Line charts for trends, bar charts for comparisons, pie charts for proportions, and scatter plots for correlations are commonly used in SaaS dashboards.
What tools can I use for SaaS data visualization?
Popular tools include Tableau, Power BI, Looker, Chartio, HubSpot Analytics, and Salesforce Reports.
How can I make dashboards more effective?
Focus on clarity, interactivity, audience-specific insights, storytelling with annotations, and regularly updating metrics to reflect business goals.

Join 5,00,000+ Subscribers
Be a part of our ever growing community.