Categories


Imagine you’re on a road trip. You’ve got your destination in mind, but you can’t just blindly drive, hoping you’ll eventually get there. You need a map, a GPS, and some real-time feedback to guide your journey. The same goes for managing a business or any data-driven project—Key Performance Indicators (KPIs) and dashboards act as your map and GPS, showing you where you are, where you’re headed, and whether you’re on track to reach your goals.
Exploring a career in Data and Business Analytics? Apply Now!
In today’s fast-paced world, data is everywhere. But raw data without context is just noise. KPIs and dashboards bring clarity and focus. They help businesses track their performance, make informed decisions, and understand how well they are doing. In this blog, we’ll break down what KPIs and dashboards are, why they matter, and how they can help you navigate your business toward success.
What are KPIs (Key Performance Indicators)?
A Key Performance Indicator (KPI) is like a signpost on your business journey. It tells you whether you're moving in the right direction. KPIs are measurable values that help you understand how well you’re achieving your business objectives.
For example, let’s say you run an online store. One of your goals might be to increase sales. A KPI could be the number of units sold each month. If that number is increasing, it’s a sign that you’re doing something right.
Types of KPIs:
-
Lagging KPIs: These are indicators that show you what’s already happened. For example, monthly revenue or customer satisfaction scores. They give you a snapshot of past performance.
-
Leading KPIs: These give you a sense of what might happen in the future. For example, website traffic could be a leading KPI for future sales. If more people are visiting your website, you can predict higher sales in the near future.
-
High-Level KPIs: These are broad indicators that give you an overview of your business’s performance. Examples include profit margins or customer acquisition cost.
-
Low-Level KPIs: These are more specific and detailed, often used by individual teams or departments. For example, the number of calls handled by customer support or the number of social media shares for a marketing team.
Why KPIs Matter:
-
KPIs help you keep your eyes on what truly drives your business forward.
-
Without KPIs, you’re essentially driving blind. KPIs give you measurable goals so you can track your progress.
-
KPIs provide insights that help you make data-driven decisions rather than relying on guesswork.
What is a Dashboard?
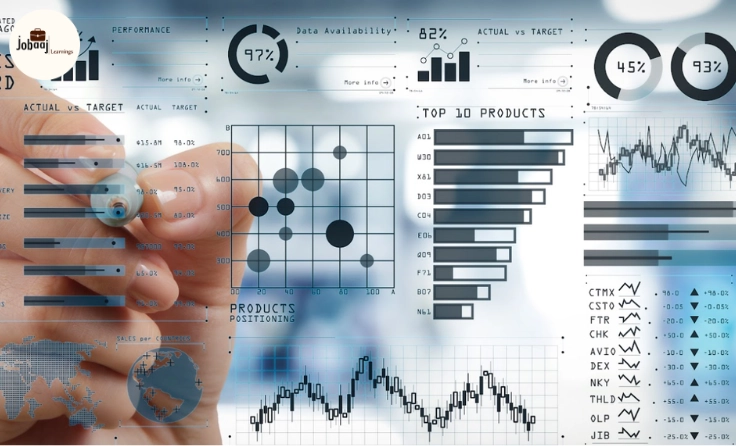
Now that we’ve established the importance of KPIs, let’s talk about dashboards. Imagine a dashboard in a car. It has all the key information you need in one place—speed, fuel level, temperature, and so on. A business dashboard works similarly. It’s a visual representation of your KPIs and other important data, presented in one place, so you can quickly understand your performance and make decisions.
Dashboards are typically interactive, allowing you to dive deeper into data by clicking on different sections or segments. They can pull in data from different sources, offering a centralized view of your business metrics.
Components of a Dashboard:
-
Visualizations: These could be charts, graphs, or tables that represent your data in a way that’s easy to understand. For example, a line graph showing monthly sales growth or a pie chart showing customer demographics.
-
Widgets: These are smaller pieces of information on the dashboard that highlight specific KPIs. For example, you might have a widget showing the total sales for the week or the current number of website visitors.
-
Filters: Filters allow you to customize your dashboard to see specific data, like performance over a certain period or by a particular department. It’s like zooming in on one area of your business to get a clearer picture.
Why Dashboards Matter:
-
Dashboards allow you to monitor your KPIs in real-time. If something changes, you can see it immediately and act accordingly.
-
Instead of sifting through raw data or spreadsheets, dashboards show your information in clear visuals, making it easier to spot trends, patterns, and areas for improvement.
-
You don’t have to go hunting through multiple reports or systems. Everything is in one place.
How to Use KPIs and Dashboards Together
KPIs and dashboards go hand-in-hand. While KPIs measure your performance, dashboards provide a visual way to keep track of those KPIs. Here’s how to effectively use both in your business:
-
Set Clear KPIs First: Before you can build an effective dashboard, you need to decide what KPIs matter most to your business. These KPIs should be directly aligned with your business goals. For example, if your goal is customer retention, a KPI like customer churn rate would be key.
-
Design a Dashboard Around Your KPIs: Once you know your KPIs, design a dashboard that tracks those indicators. Your dashboard should highlight your most important KPIs at a glance, using visualizations that make the data easy to interpret.
-
Monitor Regularly: Dashboards provide real-time data, so it’s important to check them frequently. For example, if you’re tracking sales performance, check your dashboard daily or weekly to see if you’re meeting your targets. If not, make adjustments.
-
Use Data to Drive Decisions: With your KPIs tracked on a dashboard, you can use the data to make informed decisions. If you see that a certain marketing campaign is driving more website traffic, for instance, you can decide to allocate more resources to that campaign.
Best Practices for Using KPIs and Dashboards
To make the most out of your KPIs and dashboards, here are a few best practices:
-
Keep it simple: Don’t overload your dashboard with too many KPIs. Focus on the ones that matter most.
-
Update regularly: Ensure your data is up-to-date. A dashboard filled with outdated data isn’t useful.
-
Make it interactive: Allow users to drill down into data for deeper insights. This makes your dashboard more flexible.
-
Customize for your audience: Not everyone needs to see the same dashboard. Tailor the dashboard to the role or department. A marketing team may care more about website traffic and conversions, while finance may focus on profitability.
Conclusion
KPIs and dashboards are essential tools for any business that wants to track its performance, measure progress, and make data-driven decisions. By understanding what KPIs to focus on and how to display them on a well-designed dashboard, you’ll have the clarity you need to move your business in the right direction.
Whether you’re tracking sales growth, customer satisfaction, or operational efficiency, having the right KPIs and dashboards in place allows you to monitor your goals in real-time. With this knowledge, you’ll be empowered to take immediate action when things aren’t going as planned, helping you optimize performance and stay on top of your objectives.
Aspiring for a career in Data and Business Analytics? Begin your journey with a Data and Business Analytics Certificate from Jobaaj Learnings.